Introduction to Istio, Kiali, Jaeger, Grafana, and Prometheus
1. Istio: The Traffic Director
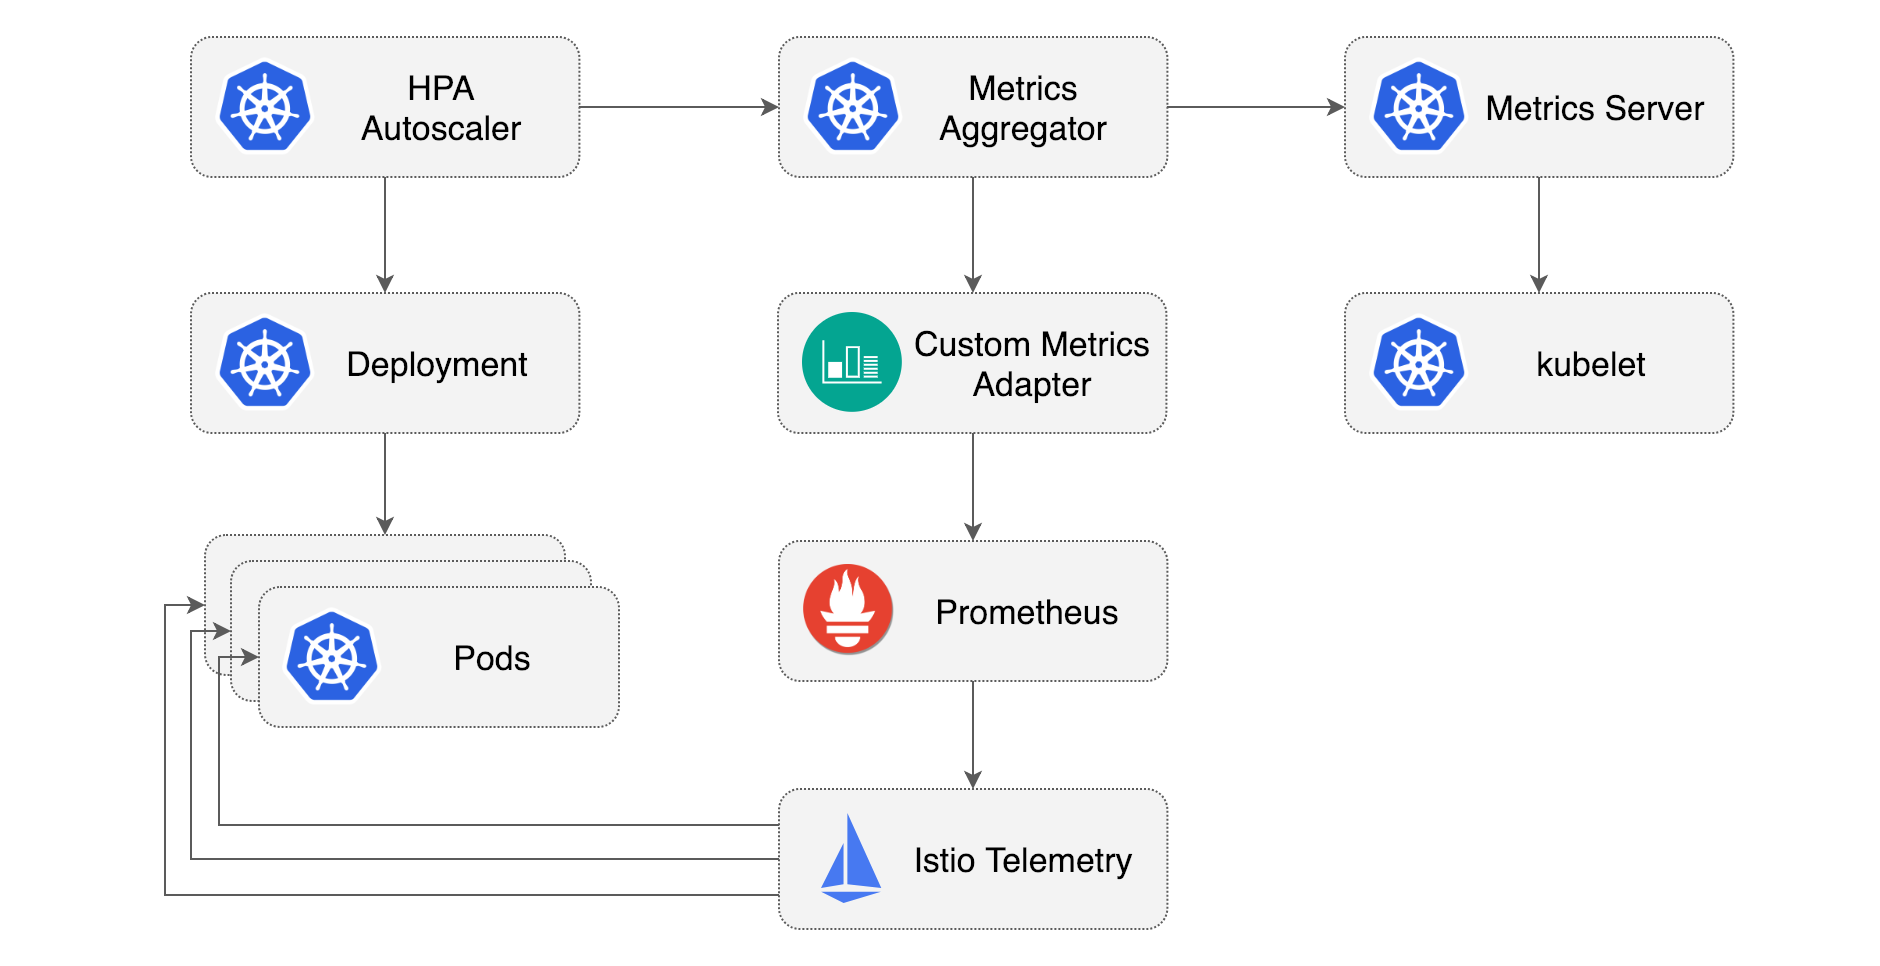
Istio is an open source service mesh that layers transparently onto existing distributed applications. Istio’s powerful features provide a uniform and more efficient way to secure, connect, and monitor services. Istio is the path to load balancing, service-to-service authentication, and monitoring – with few or no service code changes.
The control plane takes your desired configuration, and its view of the services, and dynamically programs the proxy servers, updating them as the rules or the environment changes.

Before utilizing Istio

After utilizing Istio
Imagine you're managing a bustling highway where various vehicles are moving at different speeds. Istio plays a similar role for your microservices. It's like a traffic director that helps your services communicate with each other, ensuring they're secure, reliable, and easy to manage. With Istio, you can control how traffic flows between your microservices, handle security, and even introduce fault tolerance. In simpler terms, Istio keeps the communication between your microservices smooth and organized.
2. Kiali: The Service Map Explorer
Kiali is a console for Istio service mesh. Kiali can be quickly installed as an Istio add-on, or trusted as a part of your production environment.
Ever wished for a map that guides you through a complex city? Kiali does that for your microservices! It's like a GPS for your services, showing you how they interact and helping you understand their relationships. Kiali visualizes the connections between different parts of your application, making it easier to spot bottlenecks or issues. So, if you ever need to troubleshoot or optimize your microservices, Kiali will be your trusty guide.
3. Jaeger: The Investigator
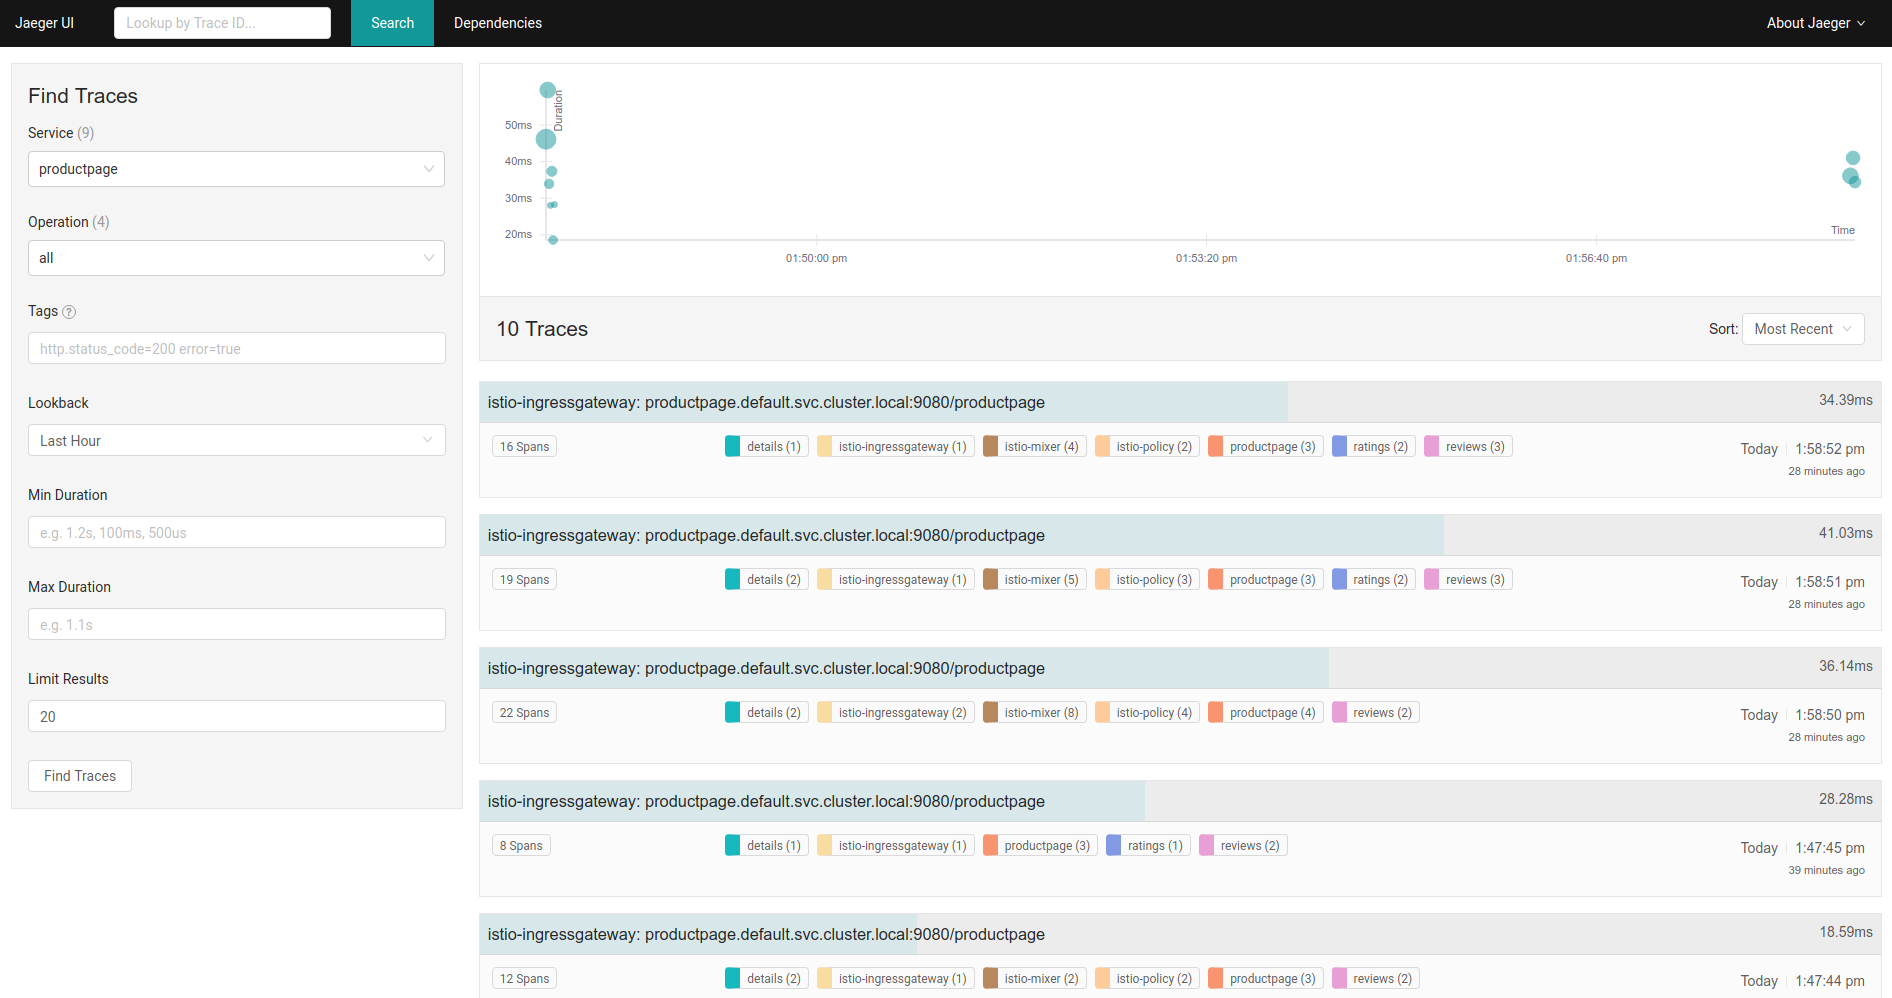
Jaeger is software that you can use to monitor and troubleshoot problems on interconnected software components called microservices. Several microservices communicate with each other to complete a single software function.
Imagine you're solving a mystery. Jaeger is your magnifying glass for microservices. It helps you trace the journey of a single request as it travels through different services. This is especially handy when you need to figure out why something went wrong or where a performance issue is coming from. Jaeger lets you see the nitty-gritty details of how your microservices work together, making it easier to catch any villains in the performance or reliability story.
4. Grafana: The Visual Storyteller
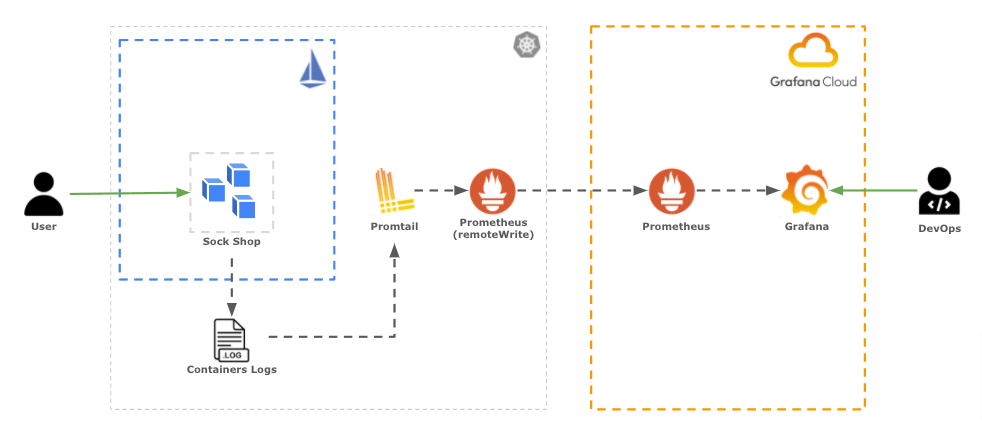
Grafana is a multi-platform open source analytics and interactive visualization web application. It provides charts, graphs, and alerts for the web when connected to supported data sources.
Wouldn't it be cool if you could turn data into beautiful stories? That's Grafana's superpower. Grafana takes data from various sources, like your microservices, and turns it into visual dashboards. Imagine having colorful charts that show you how your services are performing, how much traffic they're handling, and much more. It's like having an artist create a picture of your microservices' health and activity.
5. Prometheus: The Watchful Guardian
Prometheus is a free software application used for event monitoring and alerting. It records metrics in a time series database built using an HTTP pull model, with flexible queries and real-time alerting
Ever wished you had a guardian watching over your microservices, ready to alert you if something's off? That's Prometheus for you. It constantly monitors the health and performance of your services, collecting data and helping you spot anomalies. If your services start acting up, Prometheus will raise the alarm, allowing you to take action before things get messy.
In a nutshell, these tools are your microservices superheroes. Istio manages traffic, Kiali guides you through the map, Jaeger investigates the details, Grafana tells visual stories, and Prometheus acts as the watchful guardian. They all work together to make sure your microservices run smoothly, perform well, and stay reliable.


Comments
Post a Comment